POS Software , POS Hardware , varying Scales .
Thermal printers , price checkers, Scanners , solutions
Design and create your statistical report on your own
Check Our New Office and Show Room In Riyadh, this branch will serve all the middle area in the kingdom, and will support security system, hardware and software POS solution, POS hardware, thermal printers, scales physical security.
Do you need a POS system
As with any significant business purchase, buying a POS system should involve careful research into what the market has to offer - as well as what your own needs are.
Purchasing POS for a Restaurant
A point of sale (POS) system is one of the most important
business decisions you will make. Choose the right system and
you will simplify your life, help reduce your paperwork, give
better control of your operations, and increase the
profitability of your operation.

6 Tips to Speed Up Check Outs at the
Point of Sale
Here are 6 tips that will help you speed up check outs and keep your customers happy!
V-Data Analysis and Processing System (V-Data APS)
V-Data APS Manager key to success
V-DATA APS
The V-tech software business intelligence software is a dynamic reporting system allowing to define own statistical reports, analytical reports, Tree reports, Pivot table reports, Charts and Forms by selecting system variables, customer can save them and review them any time on defined forms, or on diagrams, or on adjustable charts, which giving comfort for working similar to the one provided by reporting applications.
With V-tech software, you can create brilliant business different kinds of statistical or analytical or normal reports, graphs, forms and other visualizations with just a few clicks of your mouse. Drill down to see exactly the information you need or build performance dashboards for sharing with anyone. Our customers regularly state that tasks that take hours in Excel are completed in minutes with V-tech software. V-tech software has two options: to be connected directly to database or connected to the data warehousing database which usually is updated every some time defined by the administrator. The system enables quick and multidimensional inspection of the data. Multidimensionality gives grounds for conducting analyses because of flexibility for accessing information. The system allows having different levels of data aggregation – for instance, annual, quarterly, daily.
V-tech software is 100% dynamic reporting software that easily integrates with any application without costly development or training. V-tech software's architecture means that report development and deployment in diverse environments no longer require costly integration of various resources, as V-tech software balances all of your available resources. V-tech software can be seamlessly integrated, and is completely customizable.
V-tech software Business Intelligence
V-tech software is a dynamic reporting and analysis system allowing defined reports which are ready for presentation on defined forms, in diagrams and in adjustable charts giving comfort for working being very similar to the one provided by reporting applications.
The system enables quick and multidimensional inspection of the data, such as sale according to products, geographical area, distribution channel, time, etc. Multidimensionality gives grounds for conducting analyses because of the flexibility for information accessing. The system allows one to have different levels of data aggregation – for instance, annual, quarterly, daily sale, sale in a given city, country, on a given continent. Calculating the increase trends, average increase, for instance, of sale in a specified time, the influence of promotion on sale is possible now – thanks to Central Management System.
V-tech software can automatically sort, count, total or give the average of the data stored in one table or spreadsheet. It displays the results as fixed reports, tree report or pivot table showing the summarized data. Such reports are also useful for quickly creating unweighted cross tabulations. The user sets up and changes the summary's structure by dragging and dropping fields graphically. The system can be connected to any kind of DBMS like ORACLE, Microsoft SQL database or any other kind of database. V-tech software is a powerful tool for data analysis, statistical reports, forms templates, fixed reports and pivot table.
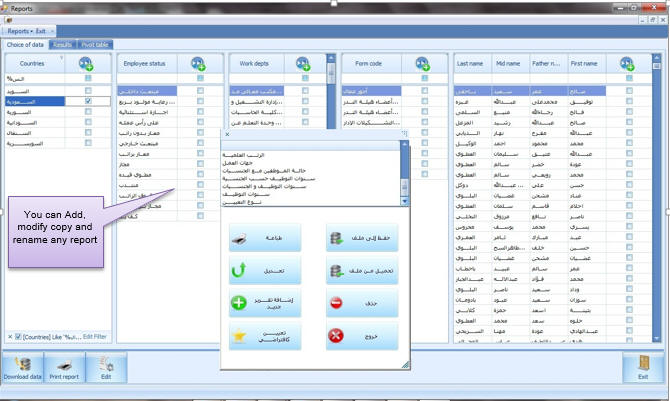
Fixed Reports
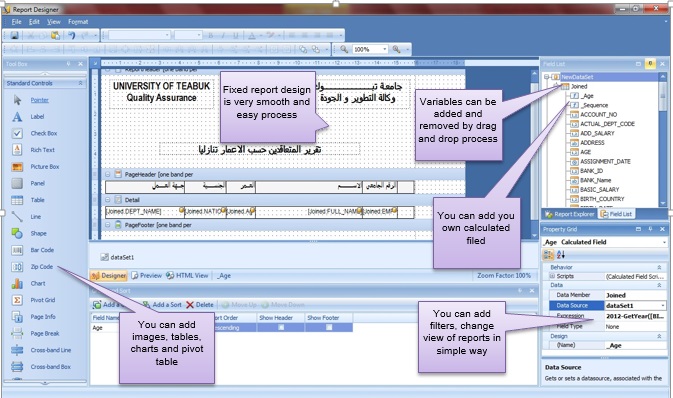
Fixed reports are the basic types of reports for V-tech software system. All reports can be modified, deleted, copied, export or import by manager or users depending on authorities. Report design screen is a drag and drop screen where user can add any variable, create new calculated variables, add charts, tables, pivot table, images, etc. in simple way. Reports output can save in many formats: PDF, HTML, MHT, RTF, XLS, XLSX, CSV, Text or image. See below images.
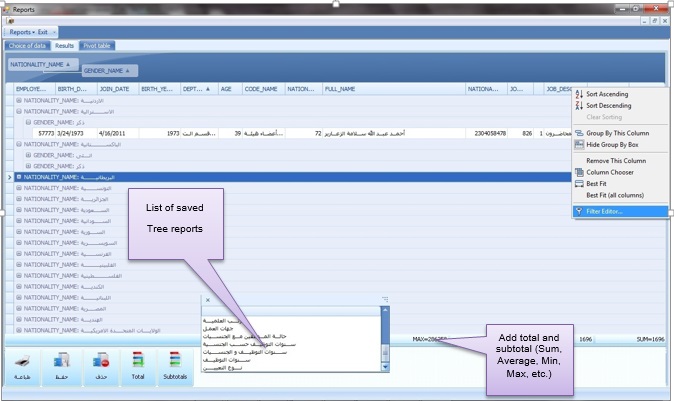
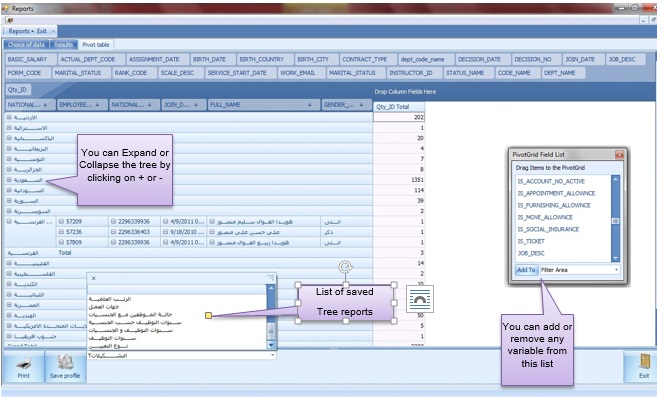
Tree Reports
Tree reports are the second type of reports in V-tech software system. All reports can be modified, deleted, copied, export or import by manager or users depending on authorities. Report design screen is a drag and drop screen where user can add any variable removed one in simple way. User can add total or subtotal calculated value like (Sum, Average, Min, Max, etc.). User can make simple filtering according to columns or he can make an advance filtering using multiple variables with an operation combination (like: or, and, contain, =, >, <, <>, etc.). Reports output can save in many formats: PDF, HTML, MHT, RTF, XLS, XLSX, CSV, Text or image. See below images.
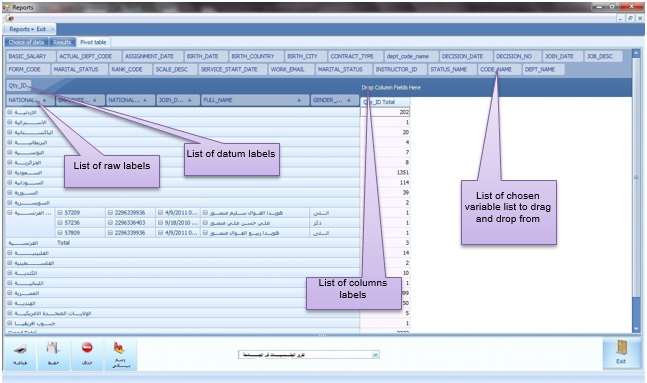
Pivot Table Reports
Pivot table reports are the third type of reports in V-tech software solution. All reports can be modified, deleted, copied, export or import by manager or users depending on authorities. Report design screen is a drag and drop screen where user can add any variable removed one in simple way. User can add total or subtotal calculated value like (Sum, Average, Min, Max, etc.). User can make simple filtering according to columns or he can make an advance filtering using multiple variables with an operation combination (like: or, and, contain, =, >, <, <>, etc.). User can Reports output can save in many formats: PDF, HTML, MHT, RTF, XLS, XLSX, CSV, Text or image. See below images.
Statistical Reports
Statistical reports can be done by one of three types of reports in V-tech software solution. All statistical reports can be modified, deleted, copied, export or import by manager or users depending on authorities. User can make simple filtering according to columns or he can make an advance filtering using multiple variables with an operation combination (like: or, and, contain, =, >, <, <>, etc.). User can Reports output can save in many formats: PDF, HTML, MHT, RTF, XLS, XLSX, CSV, Text or image
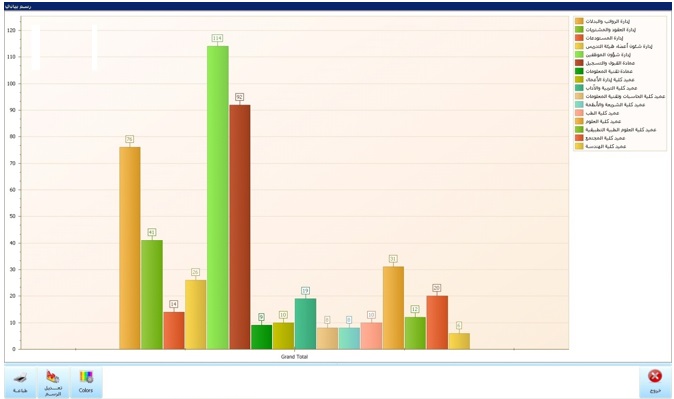
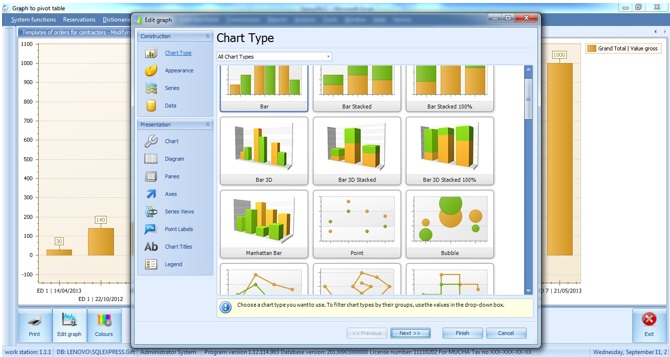
Graphic Charts
Charts are built-in in V-tech software solution. All reports data can be presented by charts. Such charts can be modified and can have different look